Season summary and revenue reports
By the end you’ll have a one-screen summary of a season, and what your league has taken in from tickets and registrations.
Before you start
- Nothing to set up. Season summary adds up your games and box scores; Revenue adds up ticket sales and paid registrations.
- Revenue is for league admins. Editors can open Reports too, and see Season summary only.
Steps
-
Step 1: In the left menu, click Reports.
Reports opens on Site traffic, with Season summary and Revenue beside it.
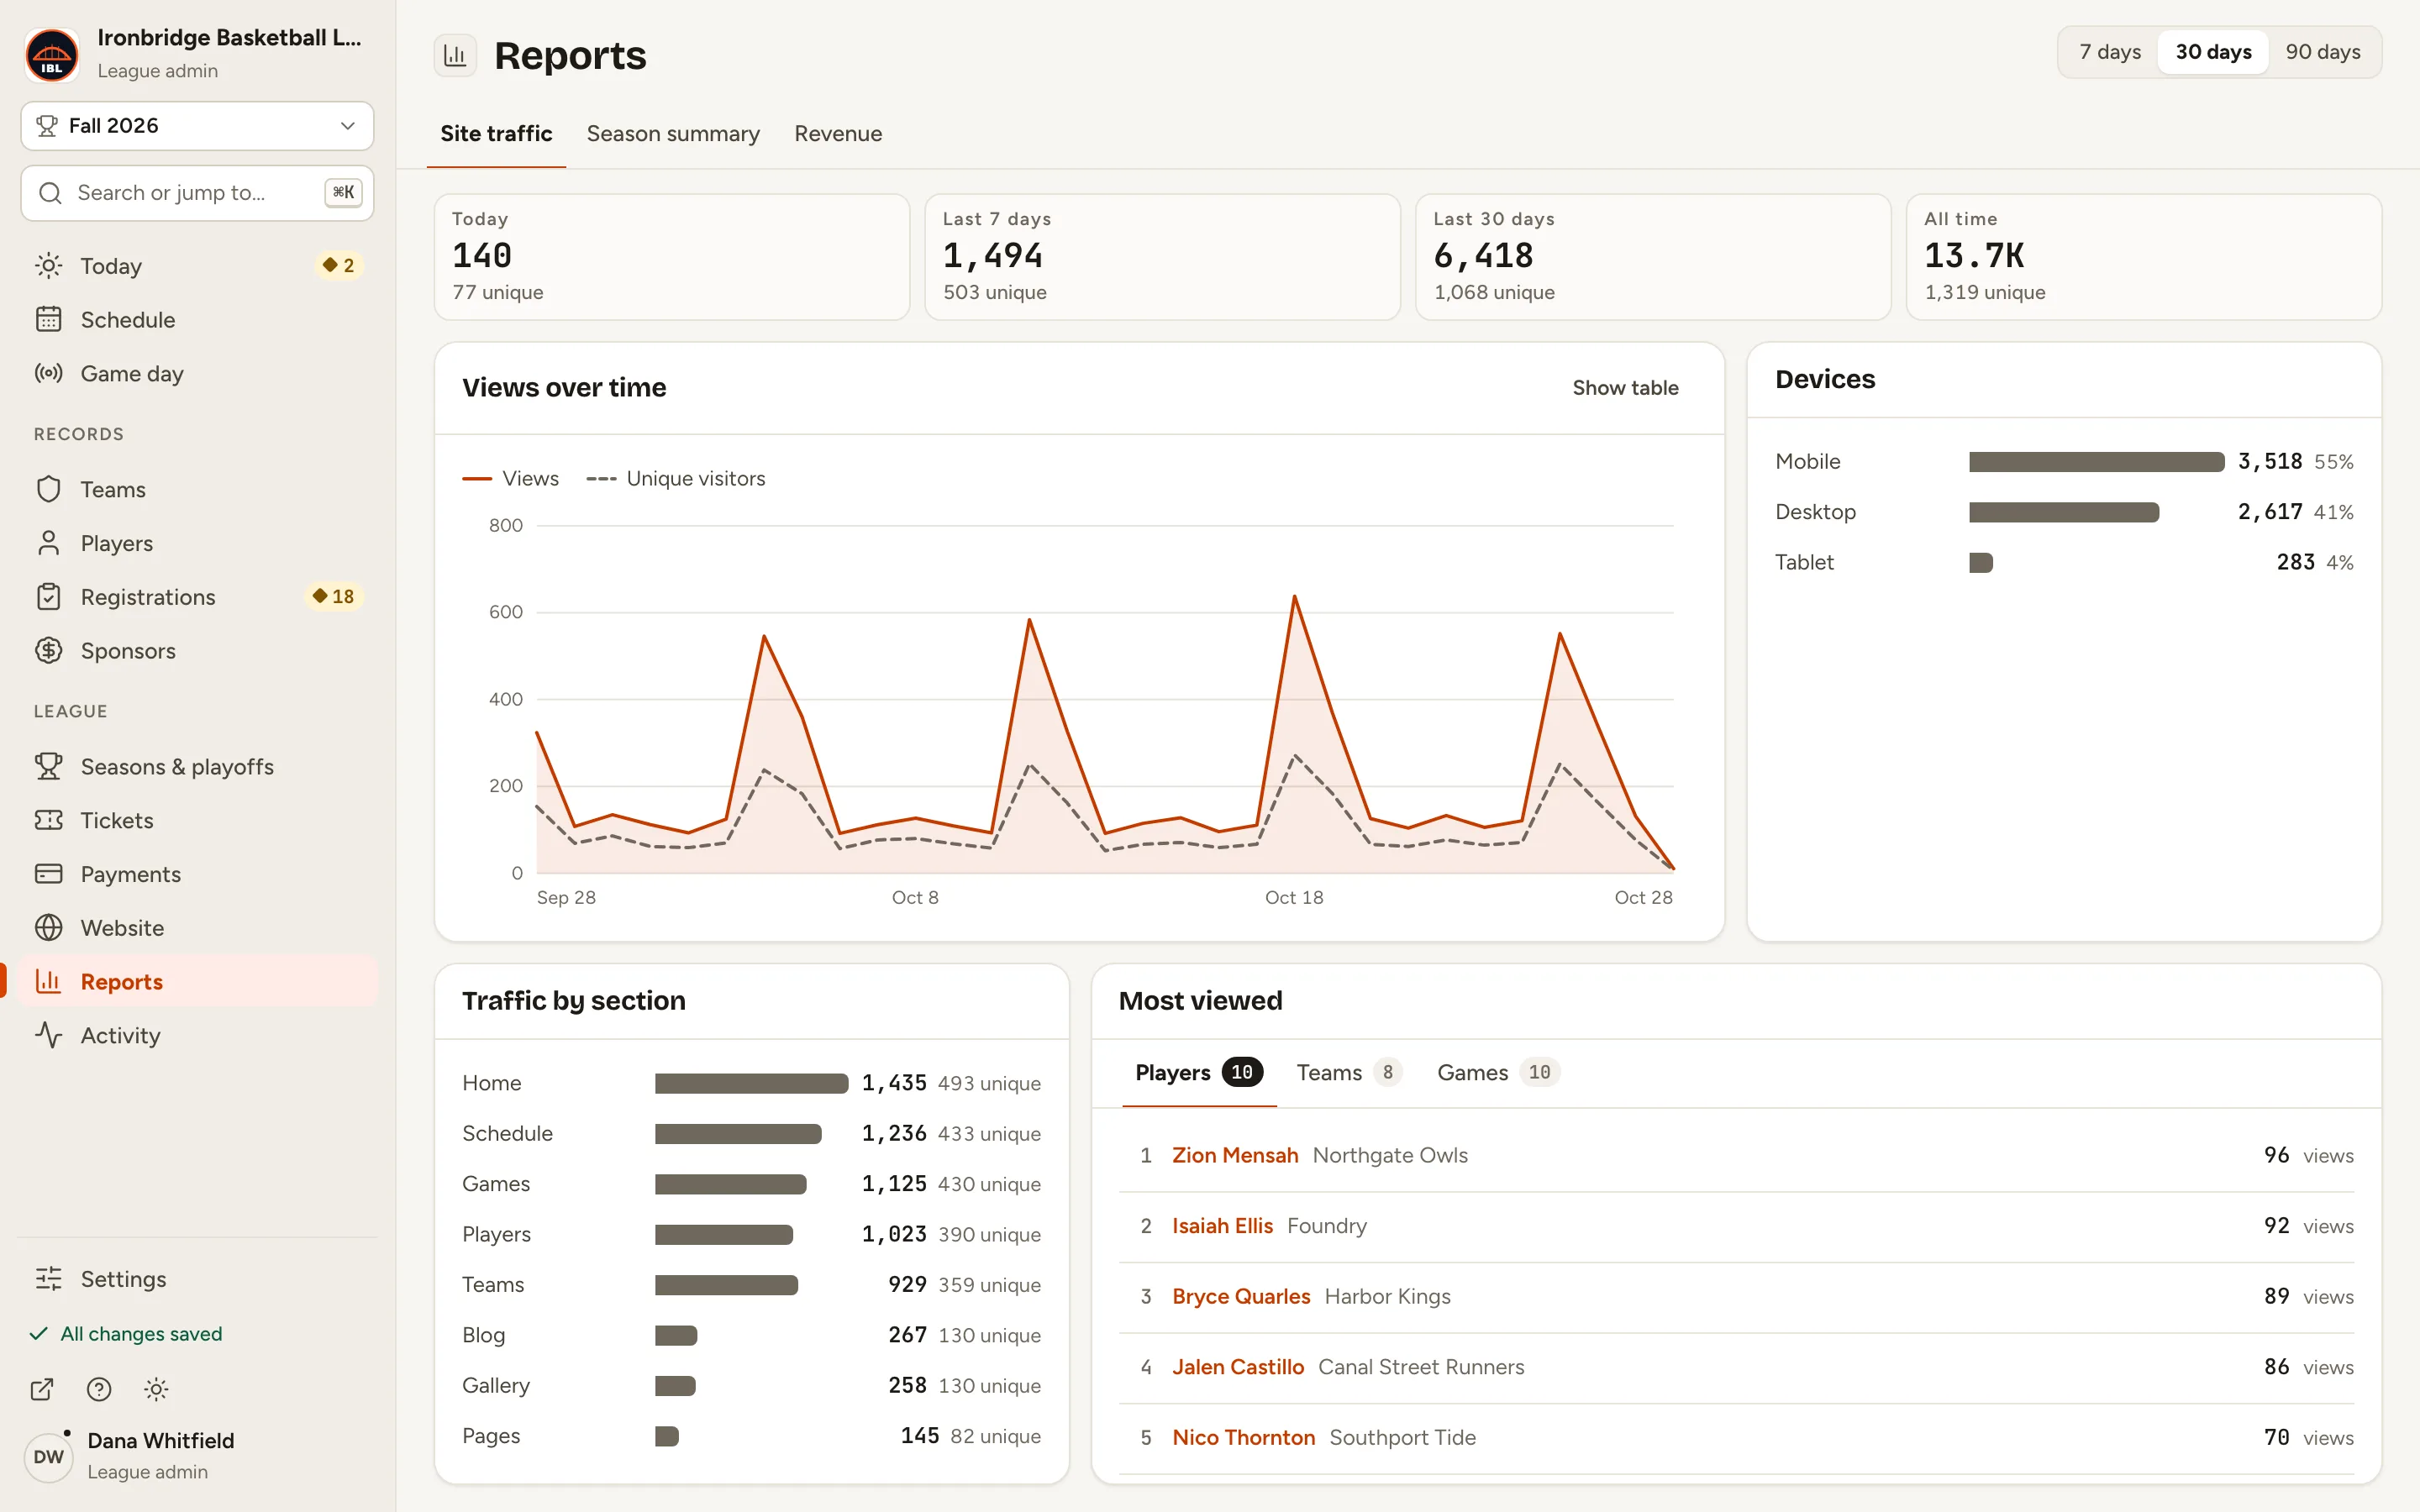
Fig. 1Reports and its three tabs. -
Step 2: Click the Season summary tab.
The season picked in the sidebar, here Fall 2026: its Teams, Games, Players and Points scored, the Standings, the Top scorers with points, rebounds and assists, and Recent results.
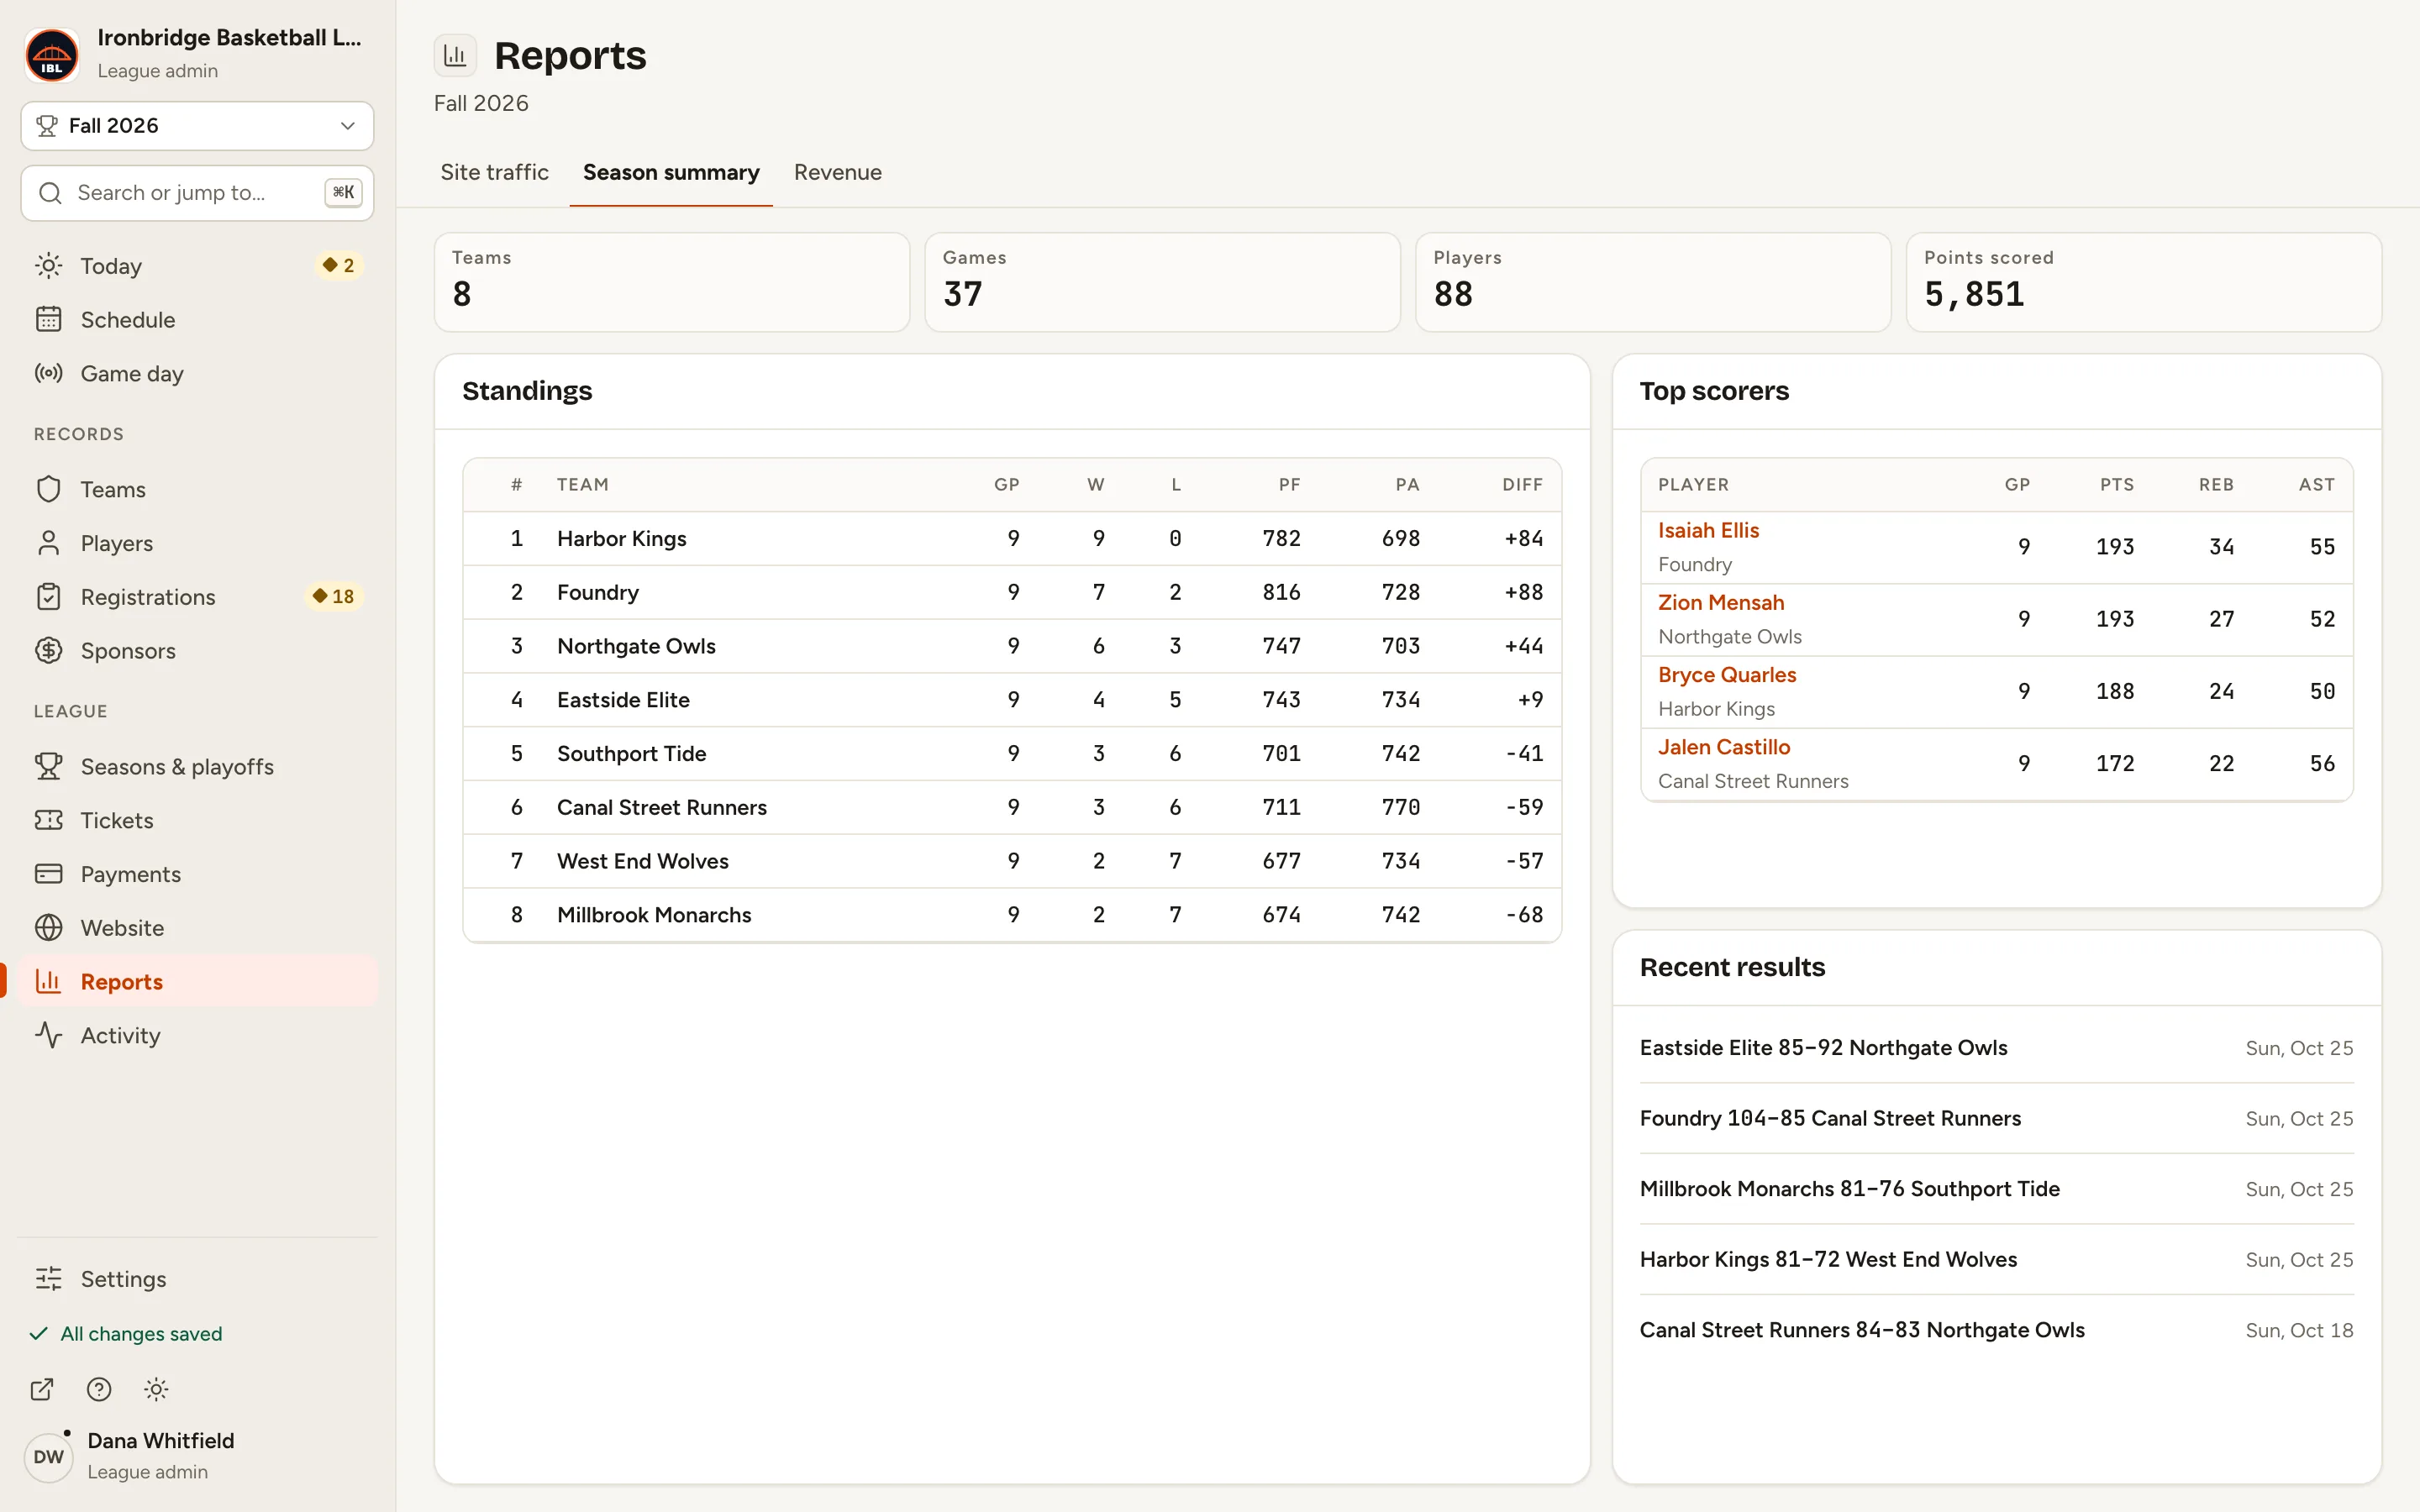
Fig. 2Fall 2026 on one screen. -
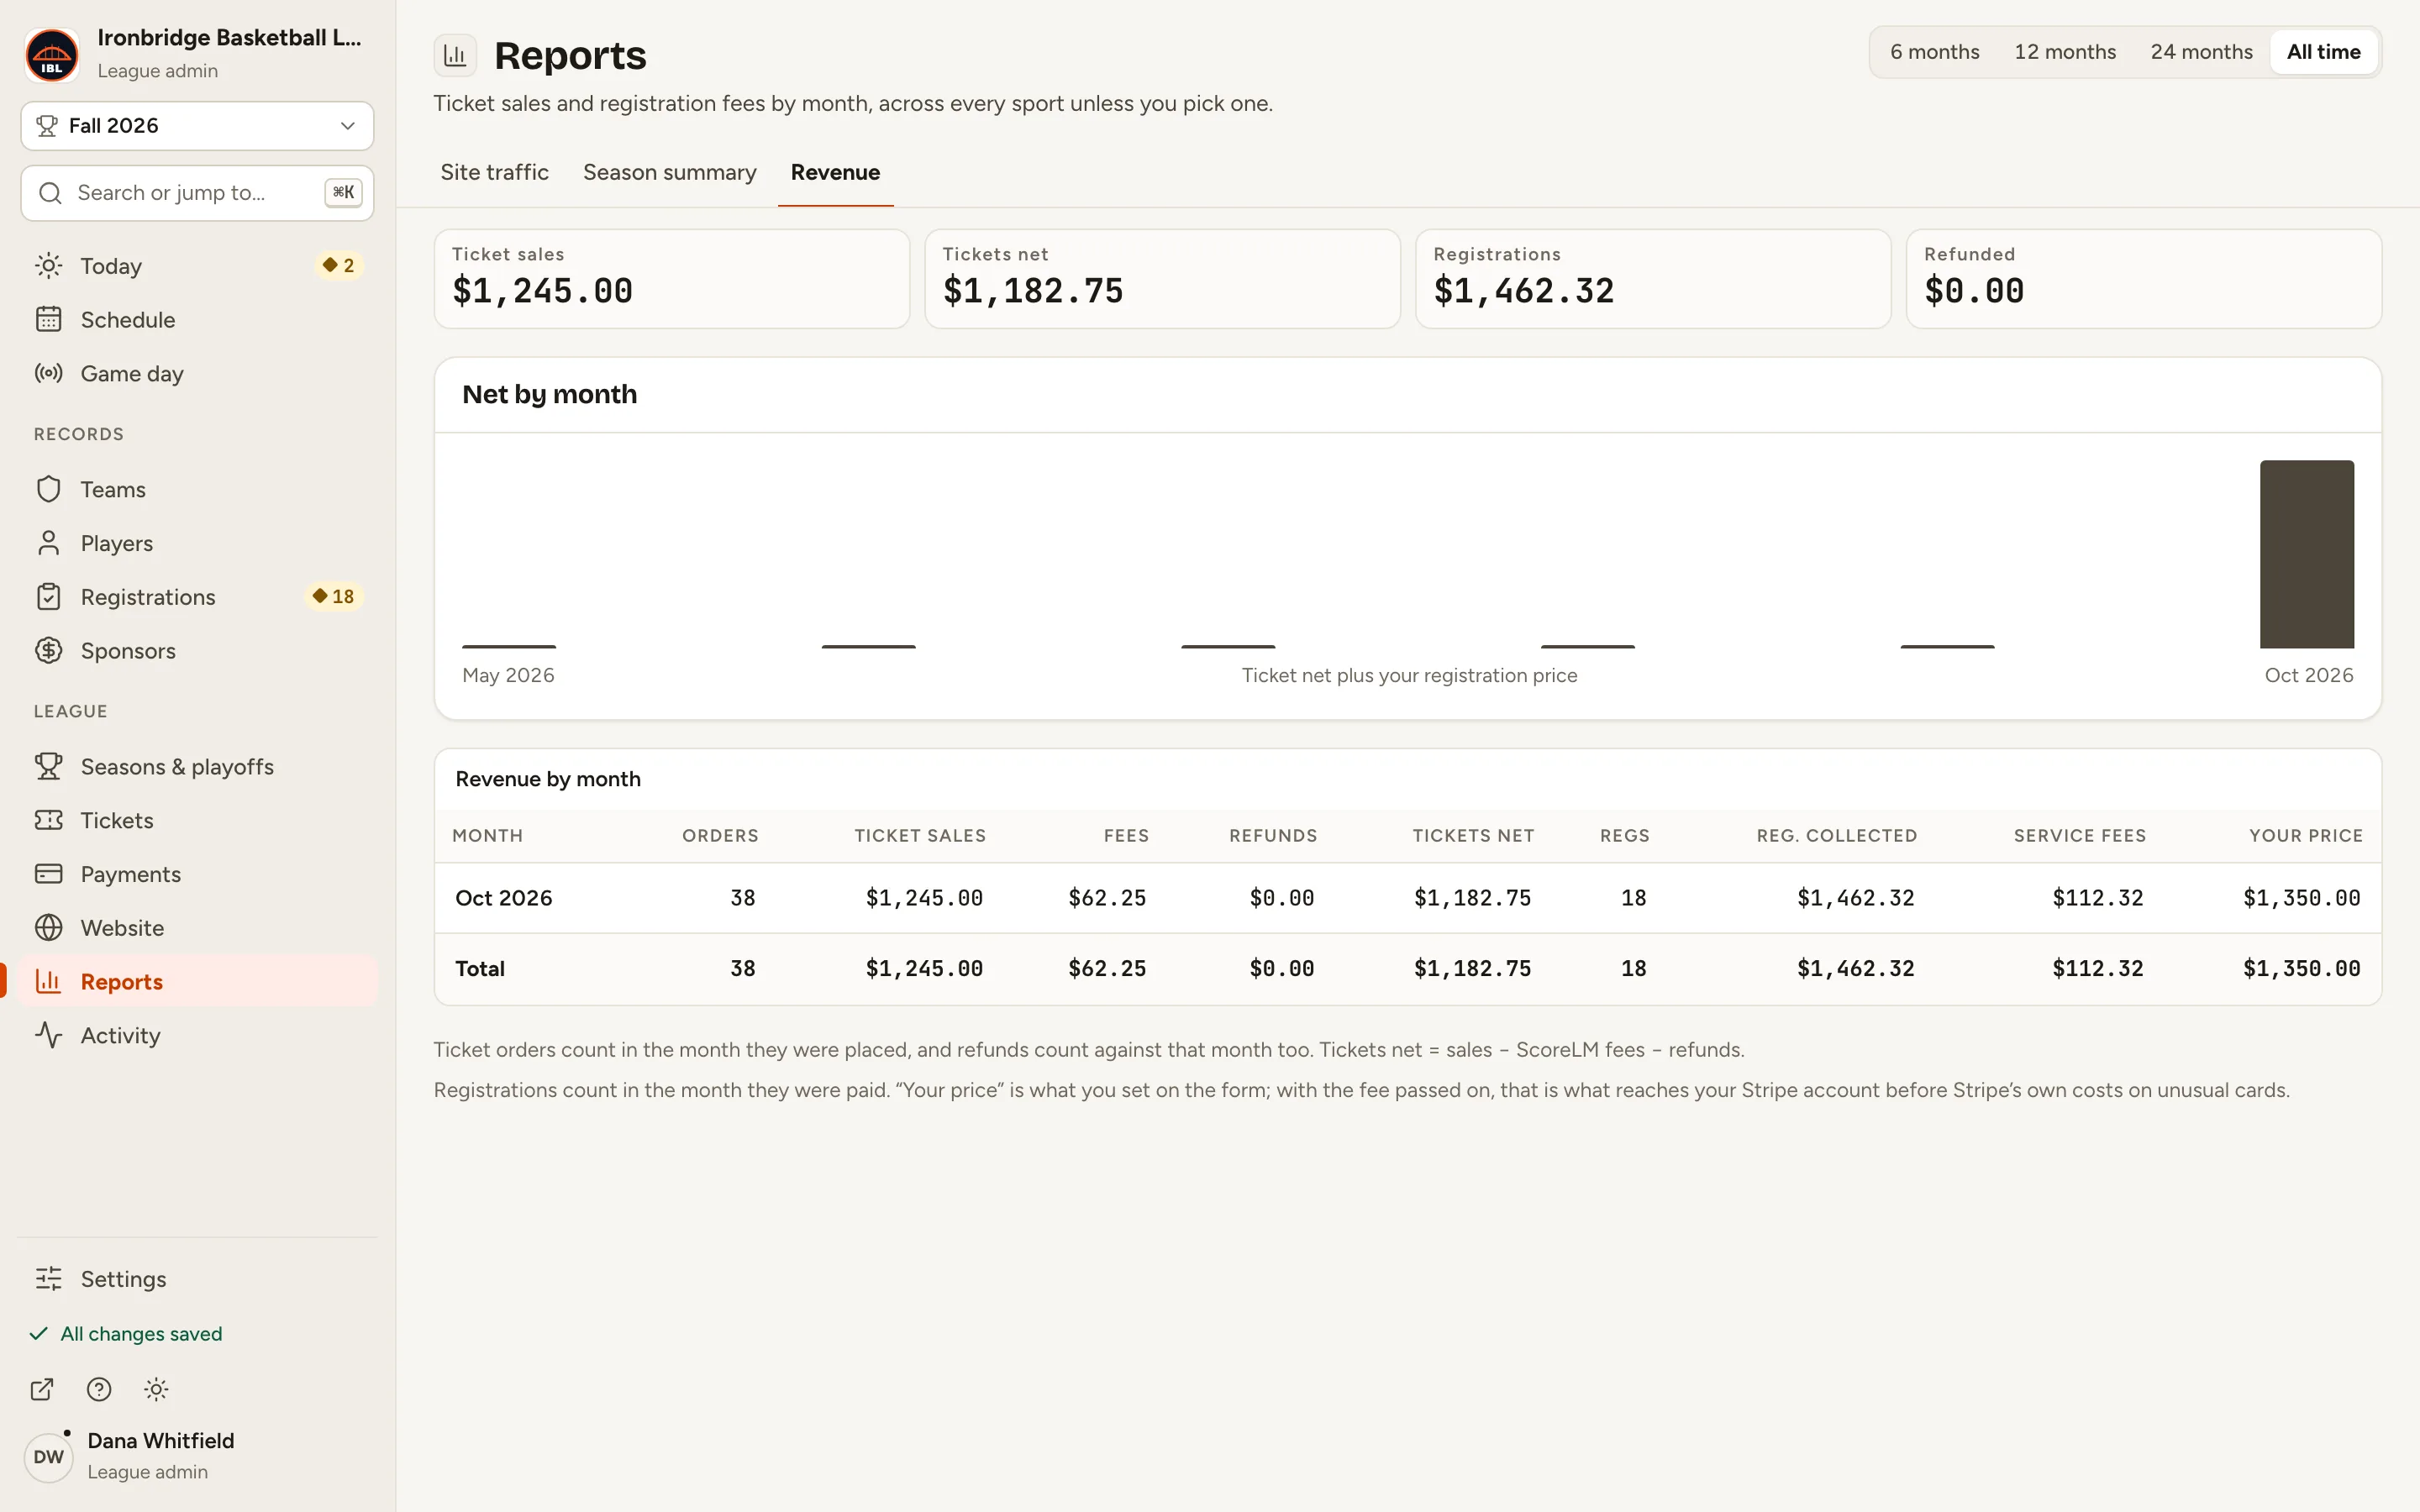
Step 3: Click the Revenue tab.
The tiles show Ticket sales, Tickets net, Registrations and Refunded. Net by month charts ticket net plus your registration price, and the table breaks each month down.
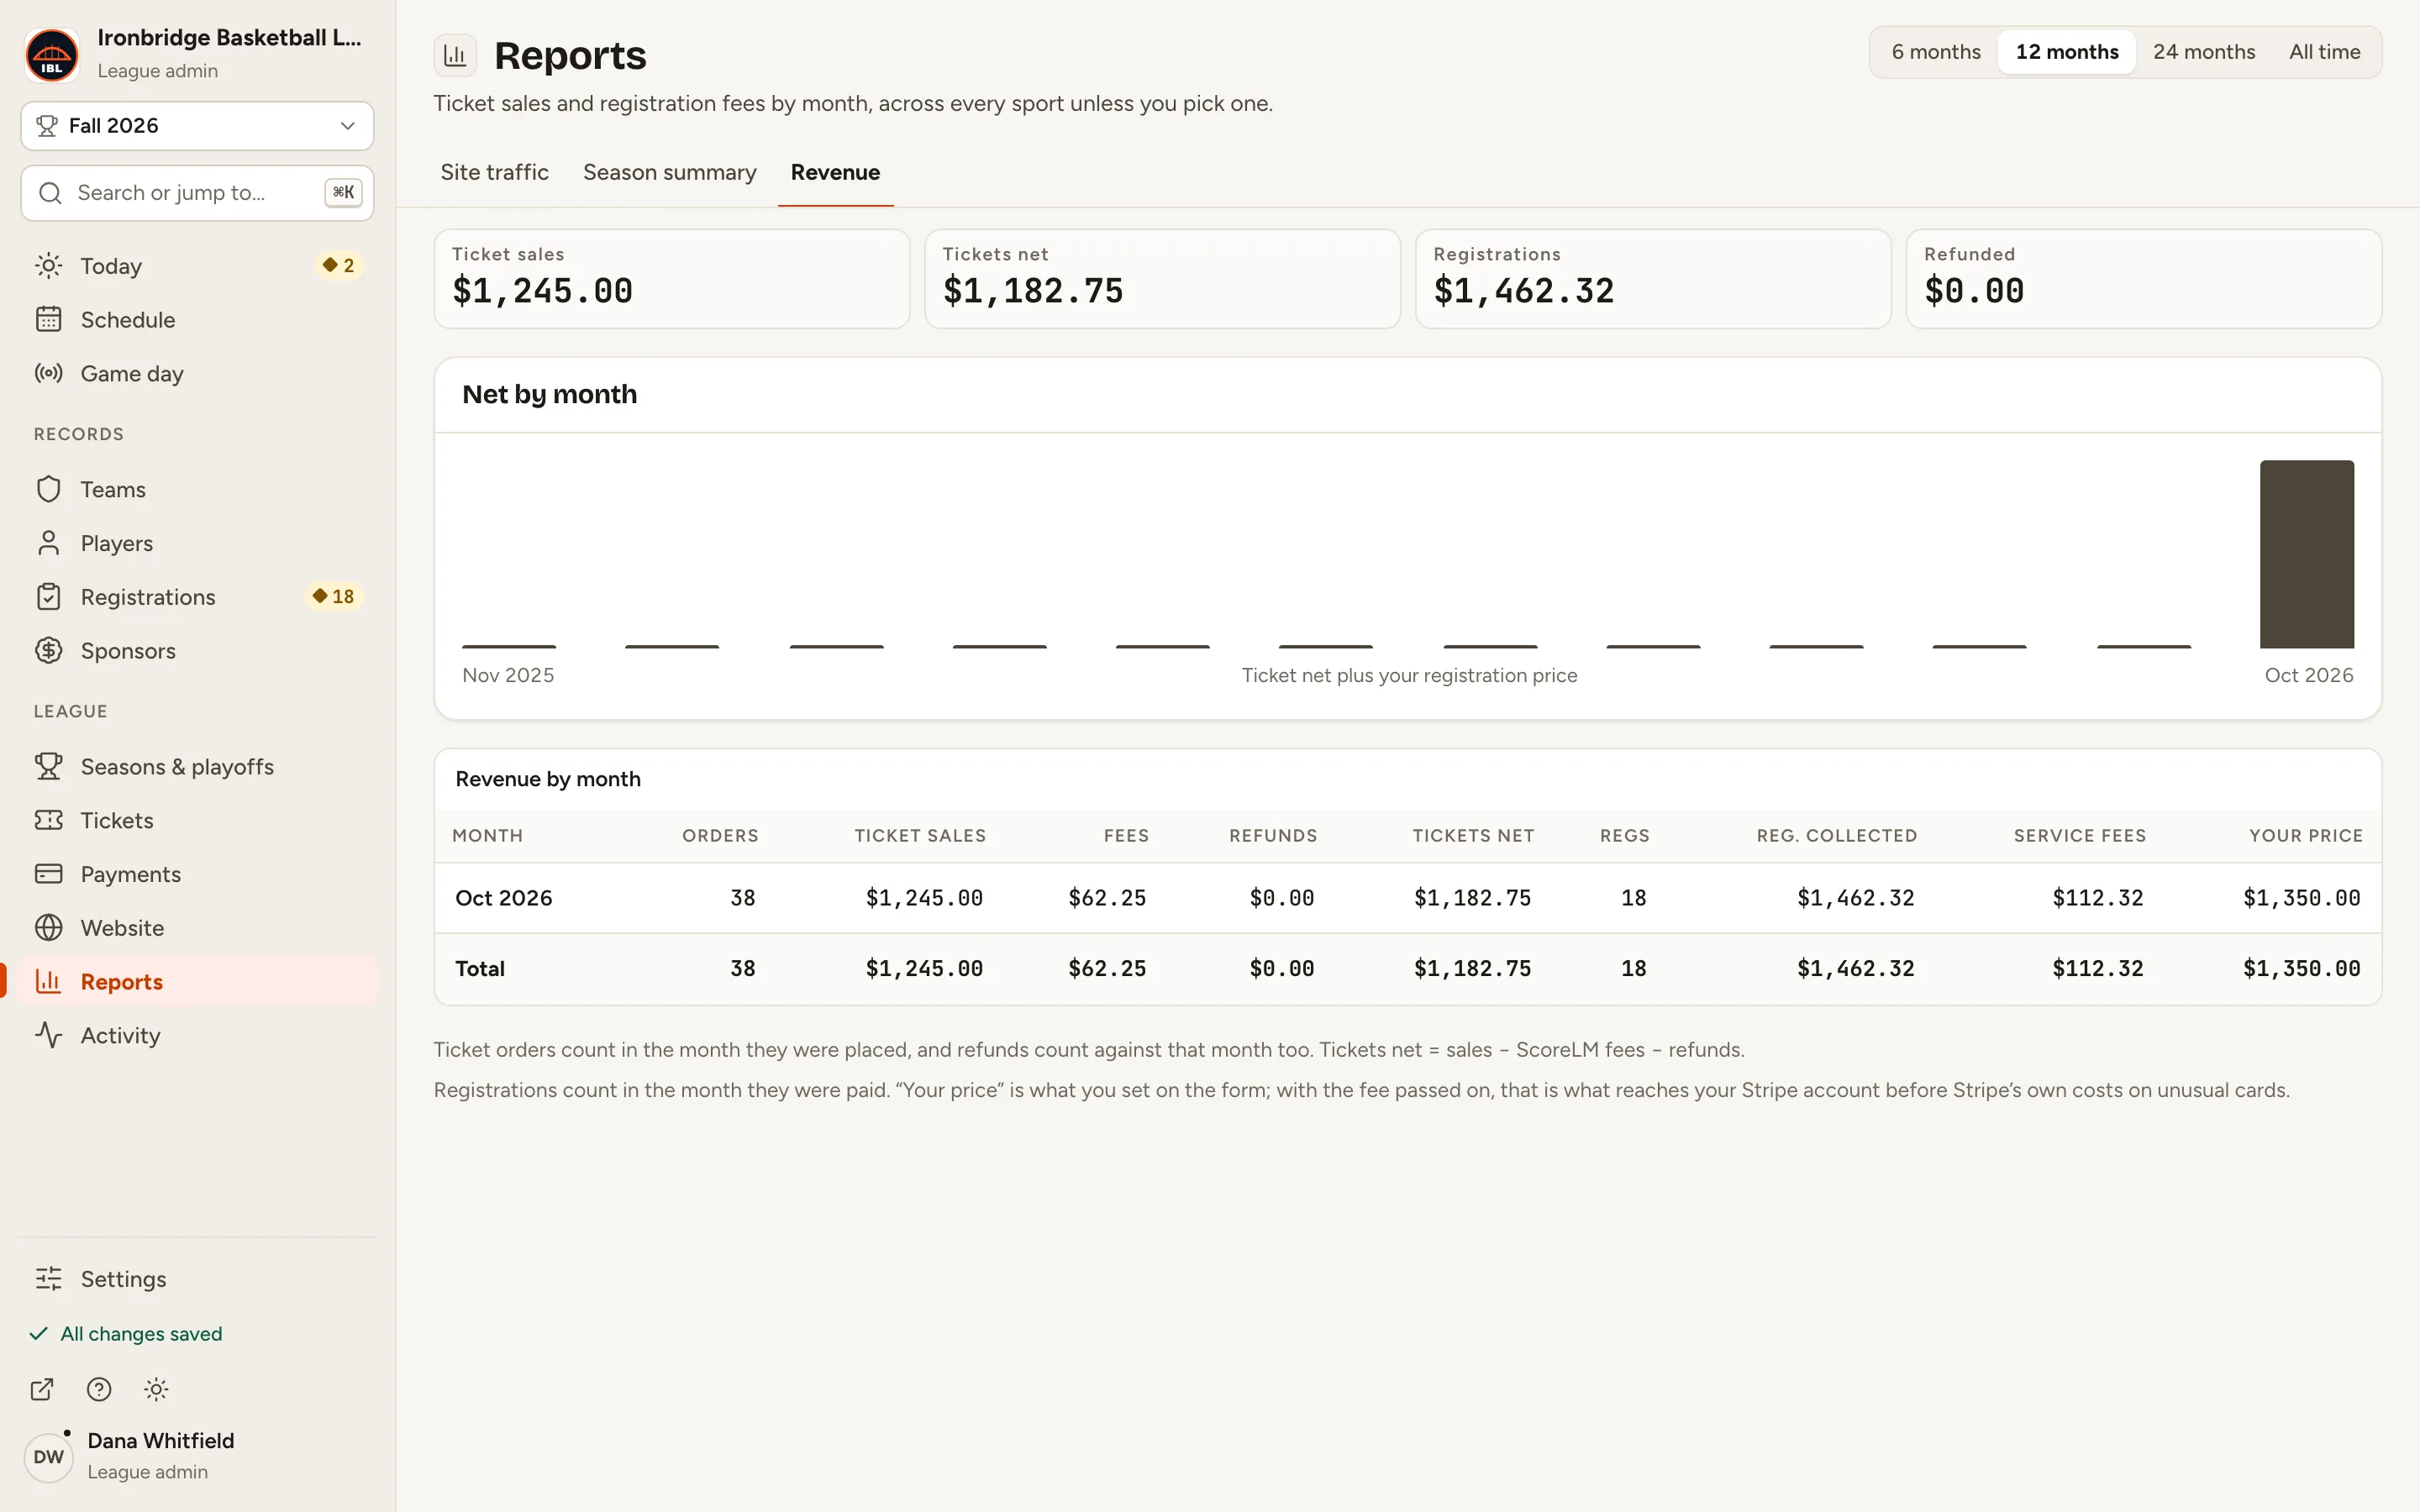
Fig. 3What came in, by month. -
Step 4: At the top right, click a range, like All time.
The tiles, chart and table cover that range. Ticket orders count in the month they were placed; registrations in the month they were paid.
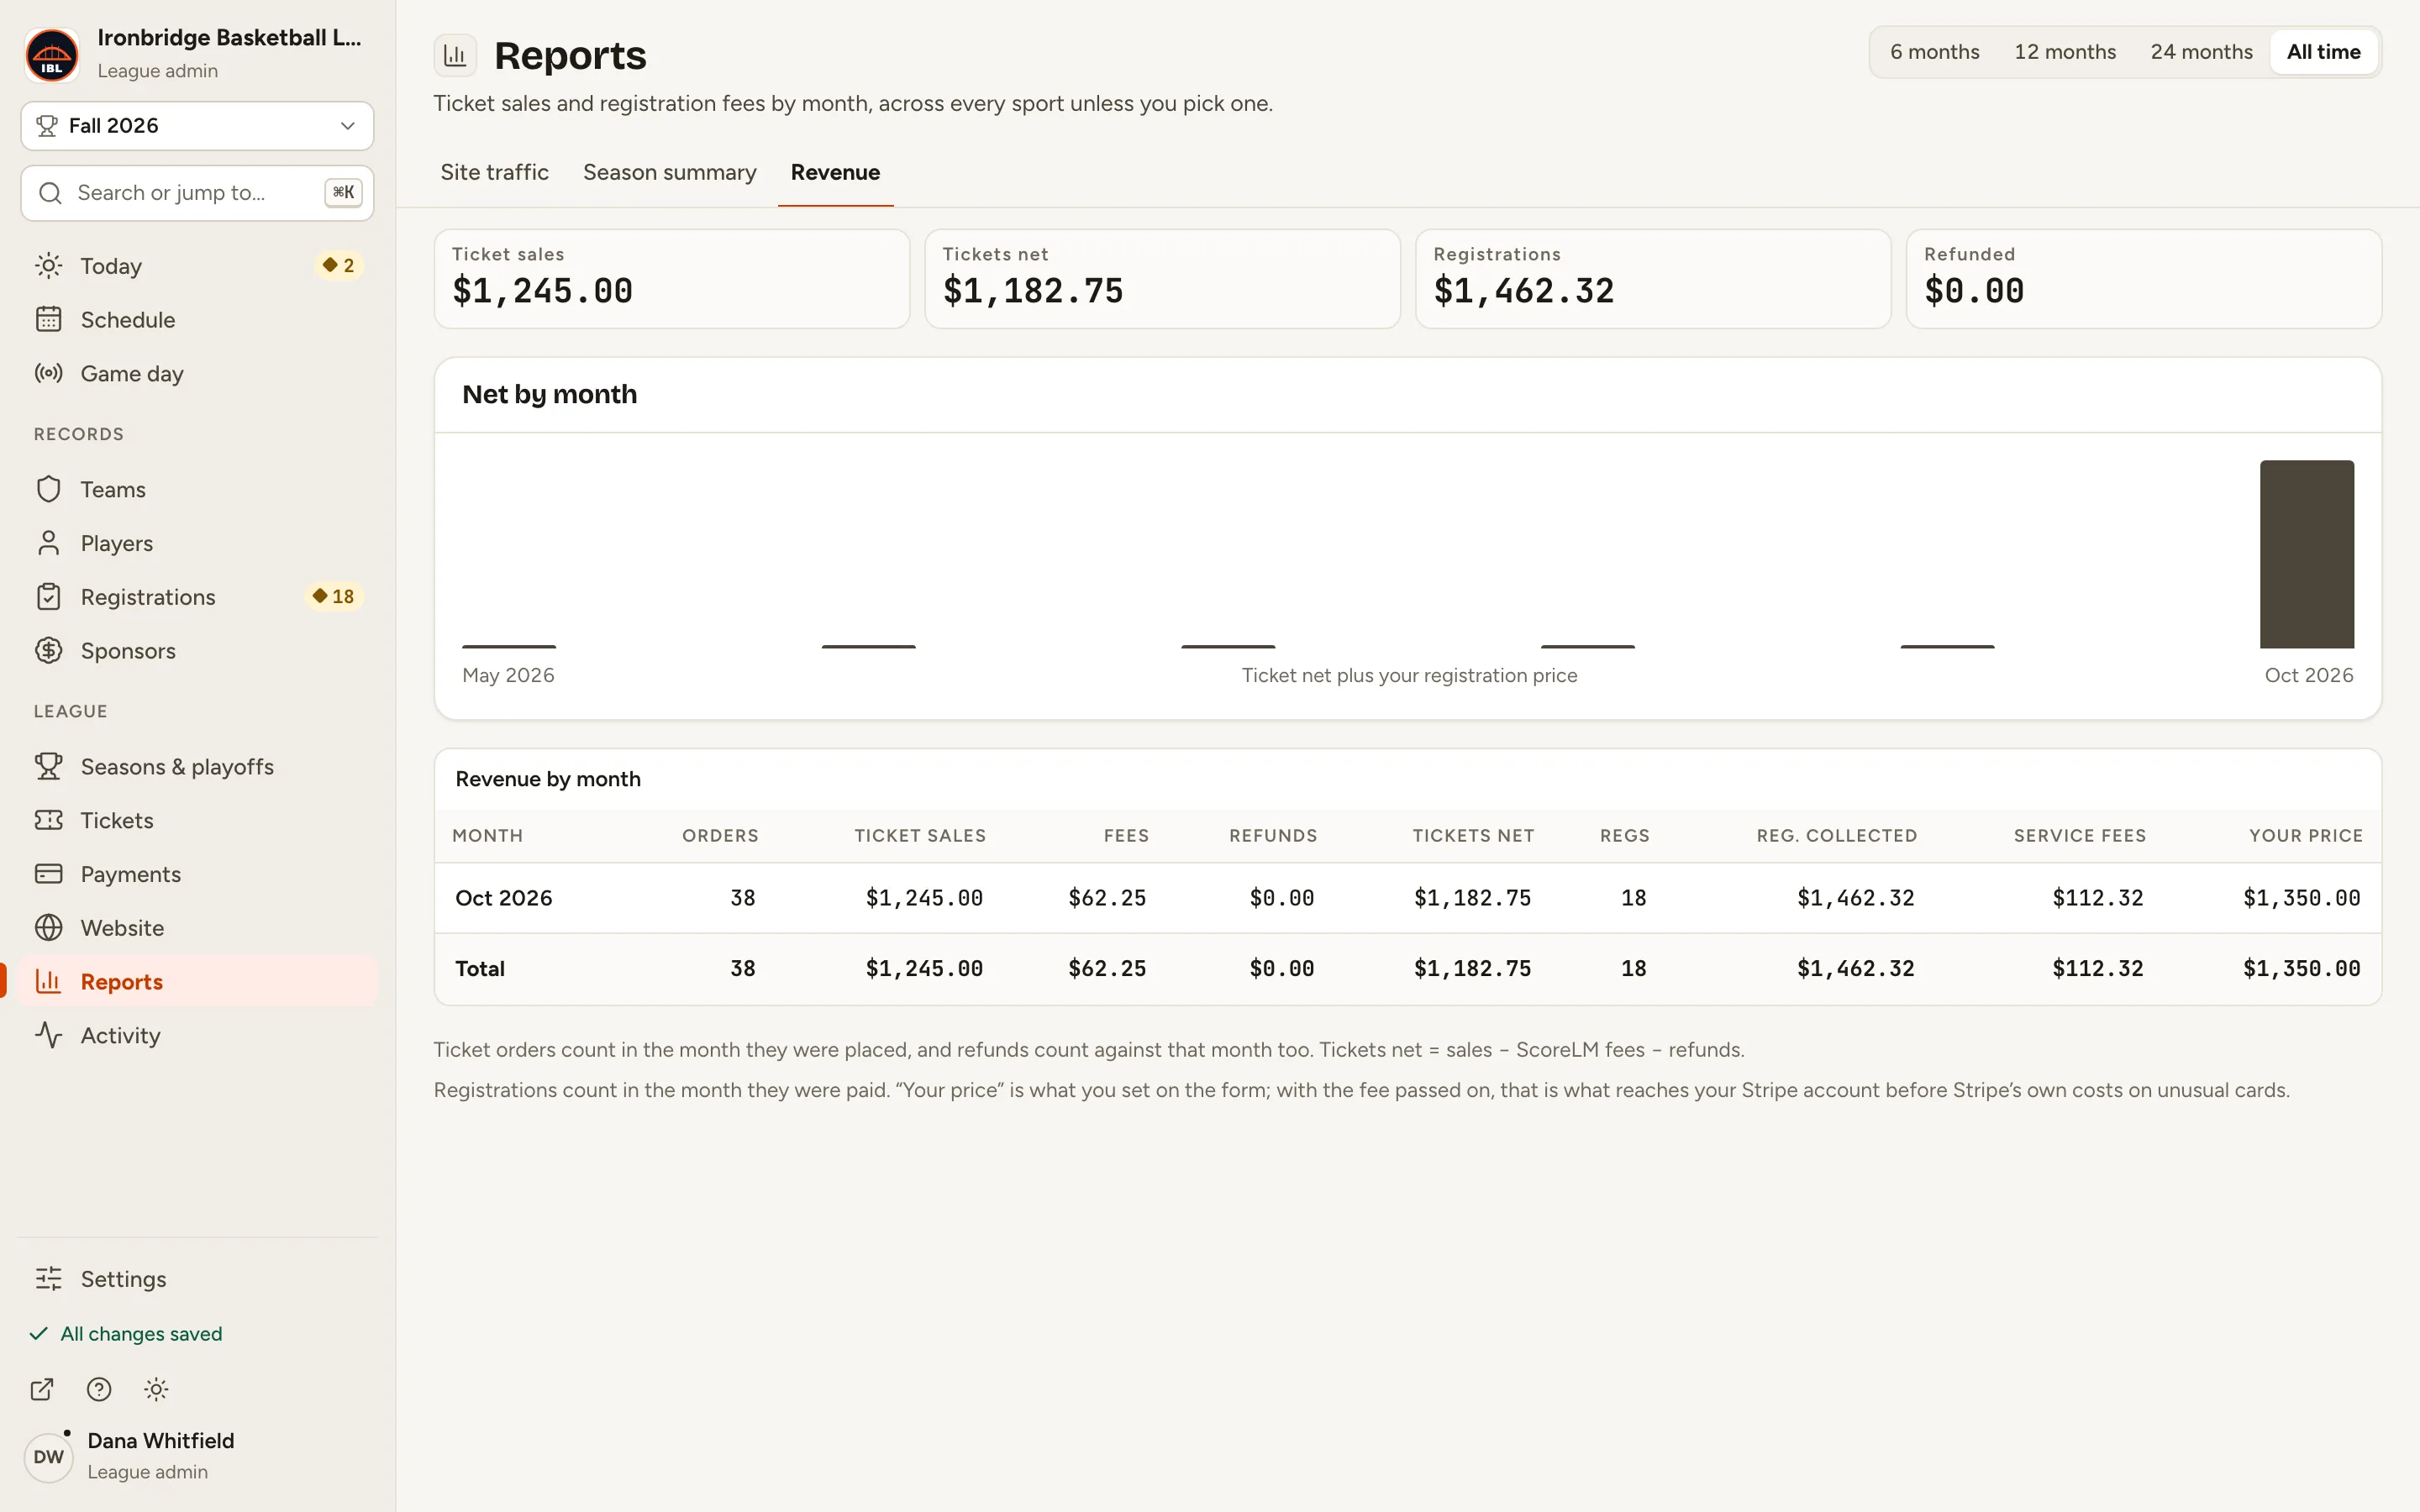
Fig. 4Everything since your first sale.
What you’ll see
You have the season at a glance (standings, top scorers and results) and your money by month: ticket sales after ScoreLM fees and refunds, and what registrations brought in.